

 Posted on Sunday, May 27, 2012
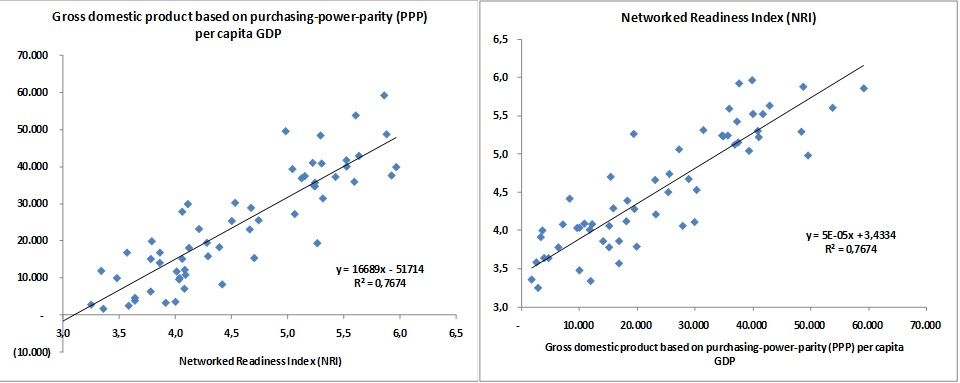
Which graph is oriented correctly? The answer is probably both.
I had the good fortune to attend the launch of the Blackberry 9220 and 9320 in Cartagena Colombia last week as one of the speakers. The launch took place in the “convention center” of the Hotel Santa Clara which is in fact the ancient chapel of the convent-converted-into-hotel. Being a speaker meant I actually got to hear the presentations because the acoustics are terrible in the chapel. I have no idea how parishoners or the sisters followed the mass in past centuries. Maybe they were just as happy not to and so no one complained.
Diego Molano the Colombian ICT Minister was one of the speakers as well and he gave his excellent rendition of the government’s “Viva Digital” program, which plans to double broadband penetration over the 4 year term of President Juan Manuel Santos.
One of his charts however, made my antena pick up. He showed a graph of % of Population Below The Poverty Line versus % Broadband Penetration and it showed an almost perfect correlation — higher levels of broadband penetration are associated with lower levels of poverty. The curve is practically hyperbolic which means that even modest levels of broadband are associated with very low levels of poverty. For someone trying to sell his cabinet peers on the need to prioritize broadband, the graph is very powerful.
The problem with this graph and others like it — my favorite is shown above — is that we are never sure how to read it: does increasing broadband penetration reduce poverty or do richer countries have more surplus to spend on broadband?
My graph, or rather graphs, show GDP per Capita adjusted for Purchasing Power Parity (PPP – a common measure of wealth) versus the World Economic Forum (WEF) Network Readiness Index (a multi-dimensional measure of technological advancement). I prefer some of these multi-dimensional measures because they go beyond mere penetration to take into account the actual usage of technologies like broadband. These try to measure if advanced technologies are transforming economic activity which would in turn be expected to increase wealth, at least a broad-based measure of wealth like PPP GDP per Capita.
But then I’m not a politician and so can afford the luxury of using complex measures. If I were a politician like Minister Molano, I’d probably use simple graphs like his.
The graph on the left is the classic policy-wonk graph: higher levels of Network Readiness are associated with higher levels of PPP GDP per Capita. This graph is showing much the same thing as the Viva Digital graph of % Poverty and % Broadband.
The graph on the right might be called the cynic’s graph: richer countries are more technologically advanced.
To be clear, this is exactly the same data; it has just been displayed differently, the axis has been flipped.
As all learned in our introductory statistics class, correlation is not necessarily causation. Clearly wealth and technology are related. We just can’t tell if one drives the other, which one drives which, or if there is a third factor that drives both.
I recently created a graph of household Internet penetration versus household spending for the various municipalities of the city of Bogota. The correlation was very high: over 90%. Here I believe that at least the short-term causation is clear: richer households can afford PCs and households with PCs are the only ones likely to have Internet at home.
However I am sufficiently optimistic to believe that that the causation works both ways. Short-term — like in the Bogota household Internet example — it is undeniable that poorer households have less of a surplus over basic necessities to spend on things which are still luxuries like PCs and Internet connectivity. They may live in neighborhoods or in circumstances (like shared accommodation) where Internet connectivity is simply unavailable.
But I also believe that medium and long-term, increasing technology — especially broadband Internet connectivity — has a salutary effect on education, which is the undeniable driver of higher wealth and lower poverty.
No Comments »
Leave a Reply